
AutoMan Intellij Debugger - visual revolution
AID is a tool designed for AutoMan developers. It is a debugger, it’s main task is to show current AutoMan program state. Data must be shown more accurate than just a human-readable hundreds of debug lines. So this is why AID is called a visual debugger.
###AID evolution
AID is empowered with two backend systems actually. One of them is behind the AutoMan program and the second one is integrated with IntelliJ Idea API - IntelliJ Idea Plugin. There is a visual layer located nn the top of this plugin. It is totally written in Scala.js. It uses many libraries and interesting technologies, e.g., WebSockets, paths-scala-js, uPickle, etc.
Today I’d like to show you how my Plugin evolved. I’ll discuss it’s layout and show you how it looked in the middle of GSoS and how it looks right now. Let’s go!
###Early beginnings
My first task was to cover the whole Plugin deployment and installation flow, integration with AutoMan program and communication.
Firstly I created AID as a simple Dialog which was a HTTP client. It was talking with AID REST Server and receiving data via JSONs.
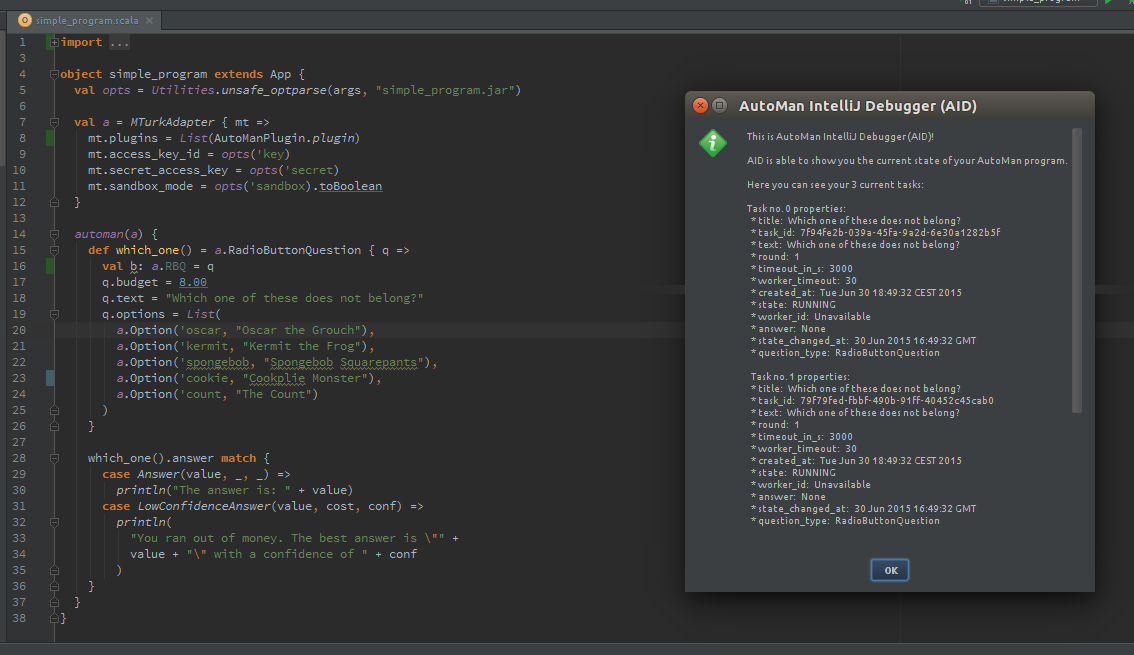 That AID wasn’t useful and even clear, but it was an important moment in my development process - it meant, that the whole development stack was ready and I was able to code.
###Tool Window
Dialog is useful when you need something for a second or only one time. It is a good place to warn user or show something. It is not a good place when you need to focus user for a while.
Dialog is always on top, over the main IntelliJ Idea window. I needed something which can be integrated with other IntelliJ Idea components. The choic was simple - Tool Window.
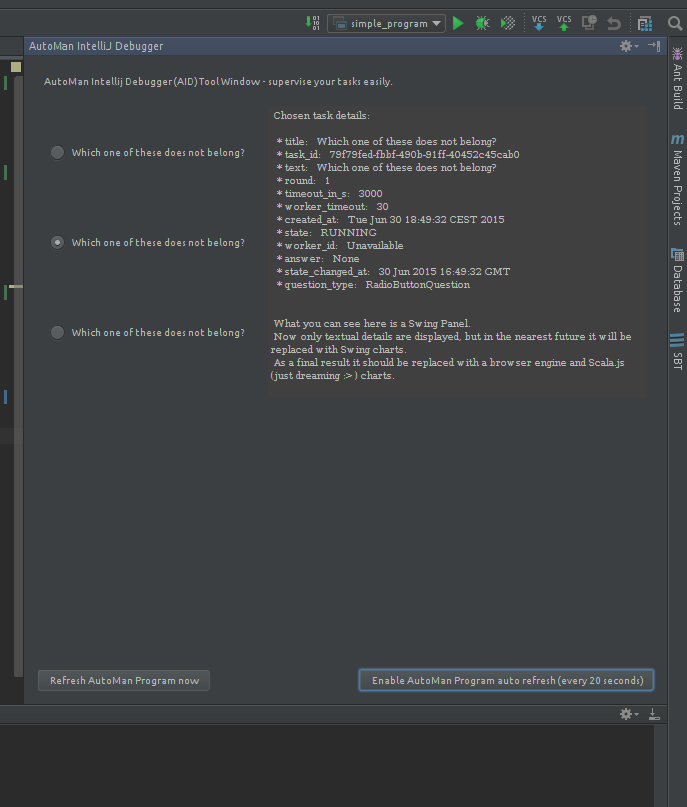 Tool Window is easy to use and very good for AID. That moment I added auto refresh logic - AID was asking AID REST API periodically and receiving AutoMan program current state.
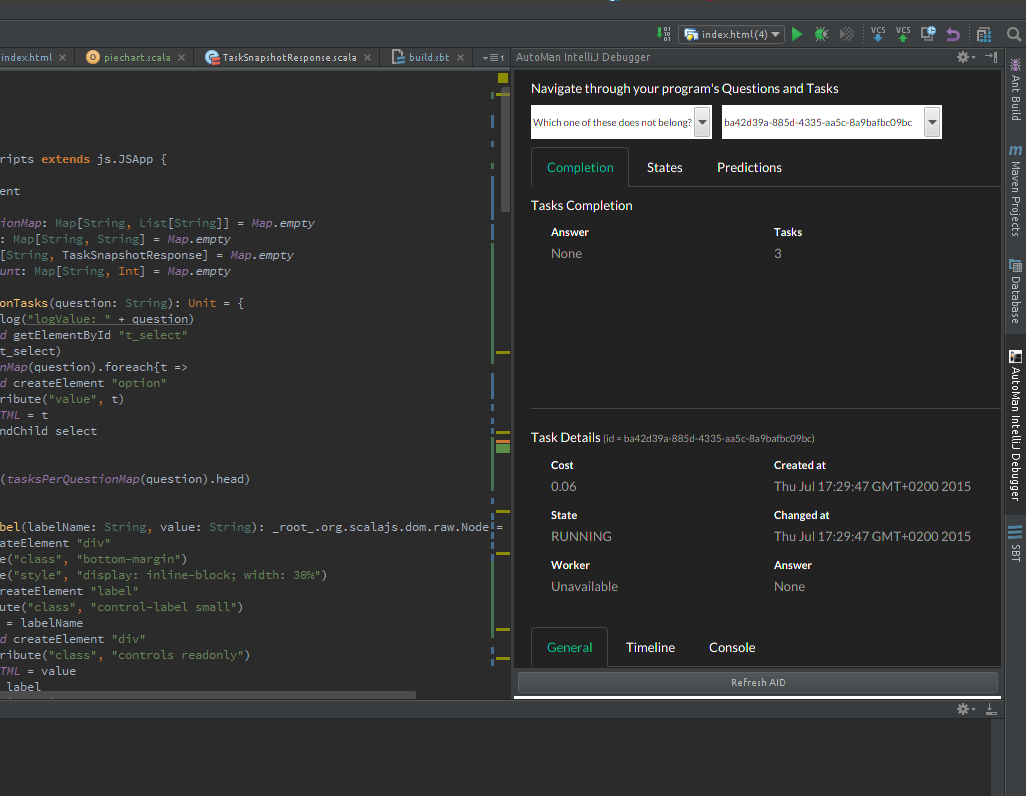
###Web browser and scala.js
We determined that the layout should be something like a canvas which must be reusable. We chose HTML and JavaScript, so I chose scala.js instead of pure JavaScript.
I use WebView from JavaFx as a browser. It was really hard to integrate AID with scala.js - but thanks to that,
AID can be run even in Internet Explorer :)! You will see later.
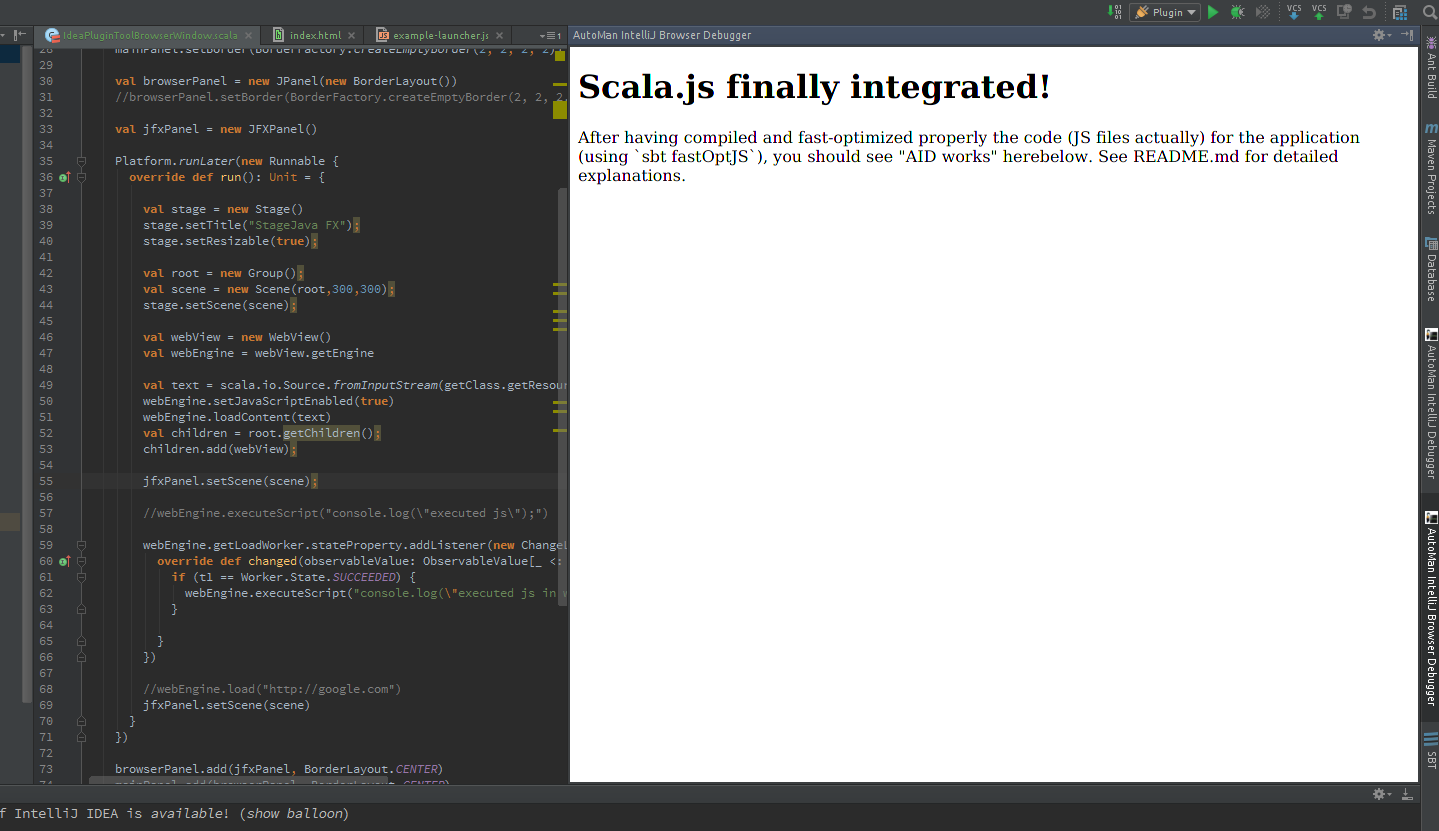 As you can see I was really exicted when I managed and finally integrated WebView and scala.js with AID.
That moment I realized, that I was able to create something “more visual”. With HTML, CSS and JS one can create awesome views and I wanted to do it!
As you can see I was really exicted when I managed and finally integrated WebView and scala.js with AID.
That moment I realized, that I was able to create something “more visual”. With HTML, CSS and JS one can create awesome views and I wanted to do it!
###Me as a designer
Dan suggested me to design AID on a sheet of paper, so I did it.
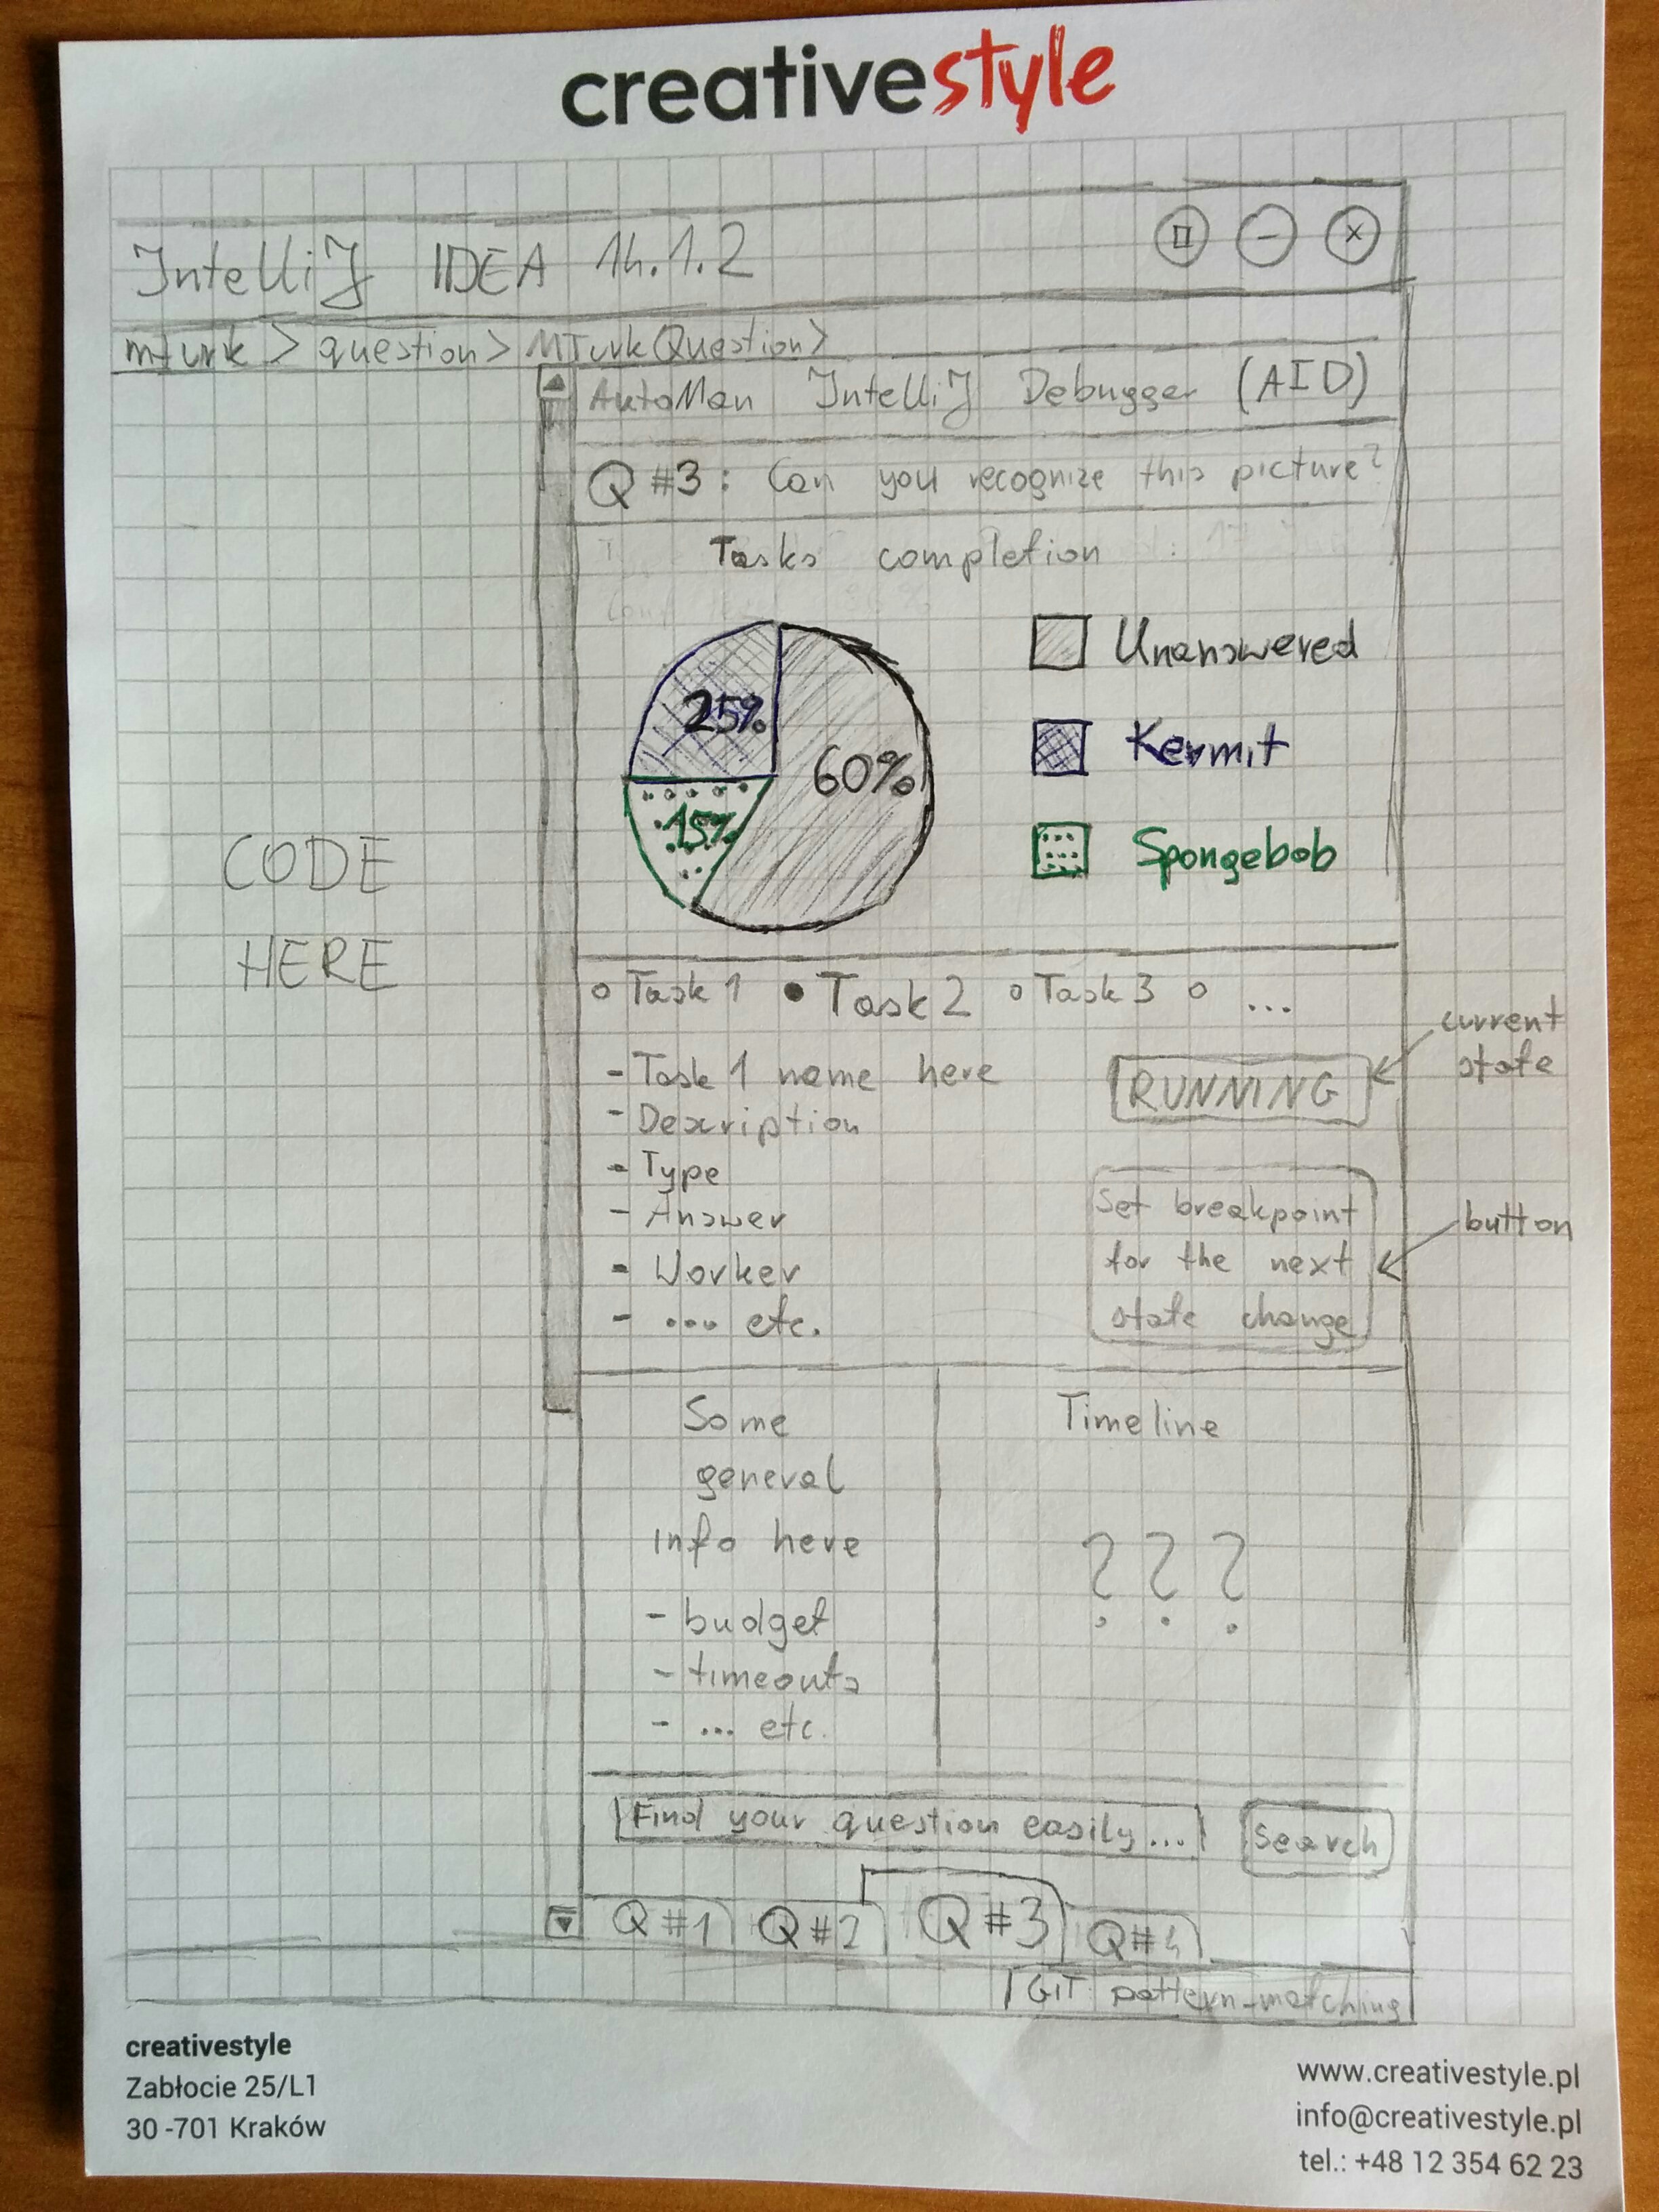 More or less it was my first idea of how AID should look like.
What we demanded:
- AID should visualize AutoMan program state
- One should be able to choose a question and a task (select boxes)
- Task states and answers should be shown on pie charts
- One should be able to see a single task details
- There should be a general question overview
- AID should be able to predict some answers
- AID should show tasks timeline
Sounds good? Look below to see how it evolved.
###Immortal Bootstrap
I added Bootstrap library to AID and designed tabs for the further functionality. Meantime I changed communication library and chose WebSockets.
At this state AID was very useful, thanks to WebSockets it was being updated continuously, so the AutoMan program state was always fresh and up-to-date.
###Charts and browser
The next step was to add some charts.
I chose SVG Paths which are implemented by Paths.js.
Of course I neeed a special wrapper fo JavaScript so I chose Paths.scala.js.
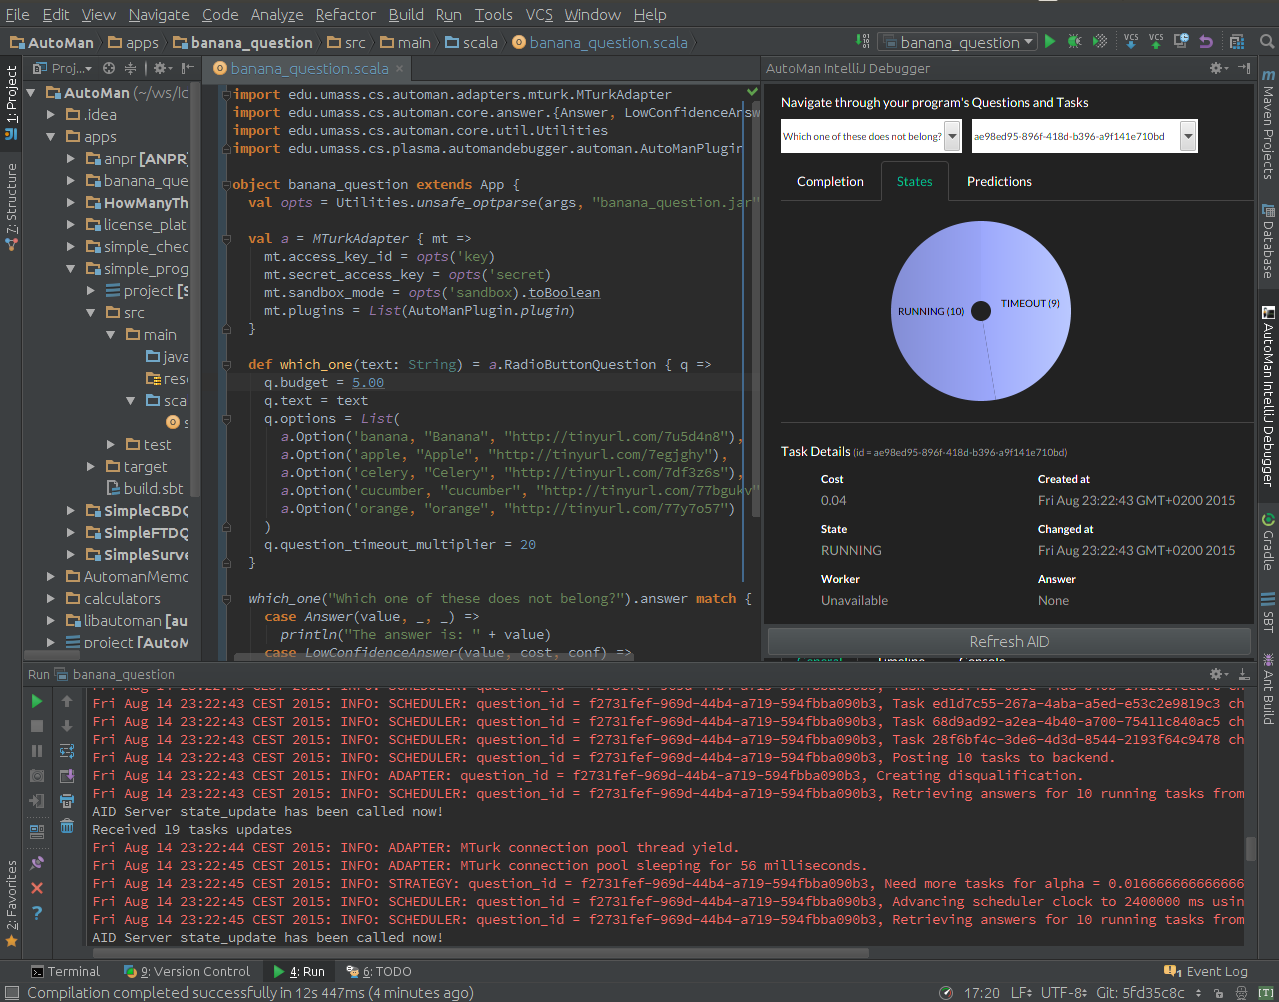 With the pie charts you can easily find out how many tasks are answered or which state is dominant. AID looked less or more as was imagining at the beginning.
It was actually a visual debugger :)!
With the pie charts you can easily find out how many tasks are answered or which state is dominant. AID looked less or more as was imagining at the beginning.
It was actually a visual debugger :)!
I mentioned that AID can be run almost everywhere! Have a look:
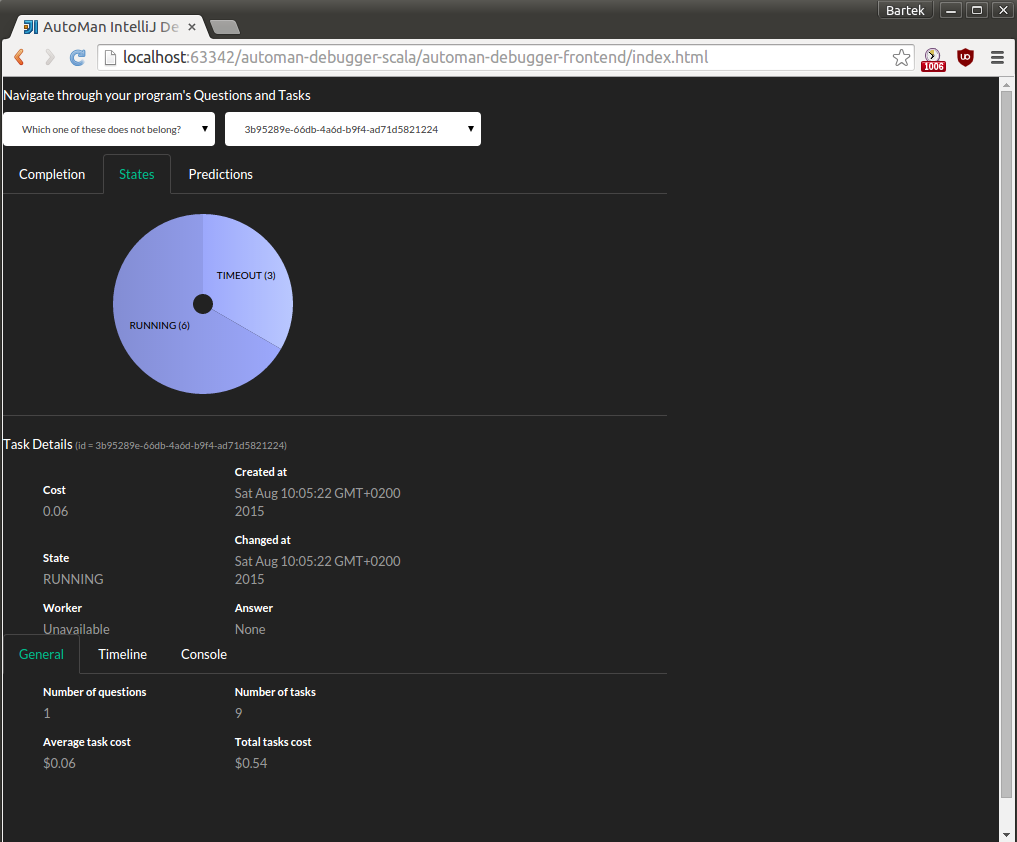 It’s really useful when you run your program remotely and you cannot overview this program within your IntelliJ Idea.
###Timeline
The most recent feature is tasks timeline. You can watch tasks historical states and conclude which of them are broken or whatever.
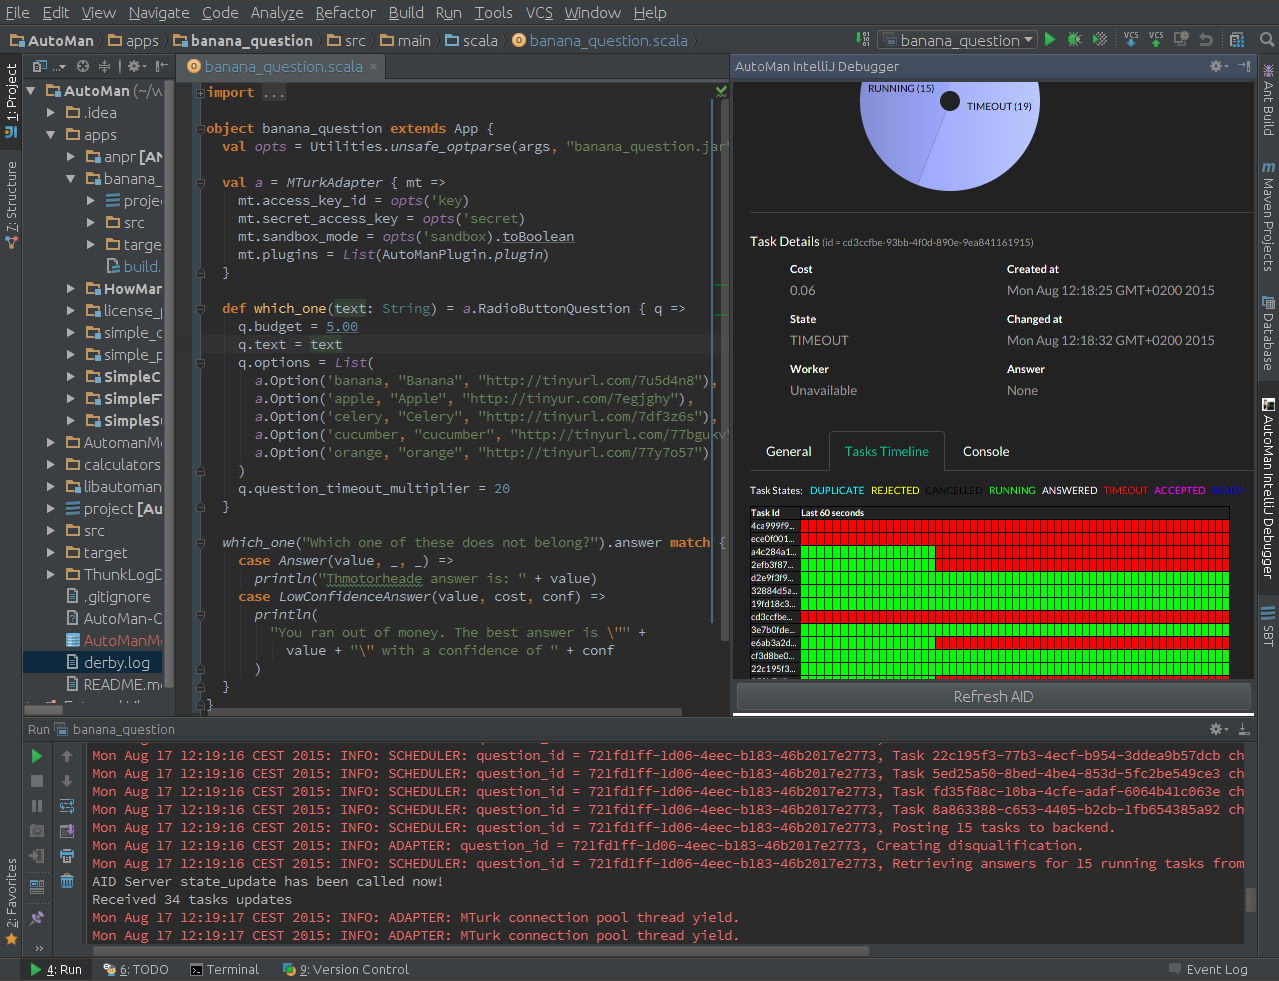 I know it’s not pretty, but it’s my own implementation, existing chart libraries don’t meet my requirements!
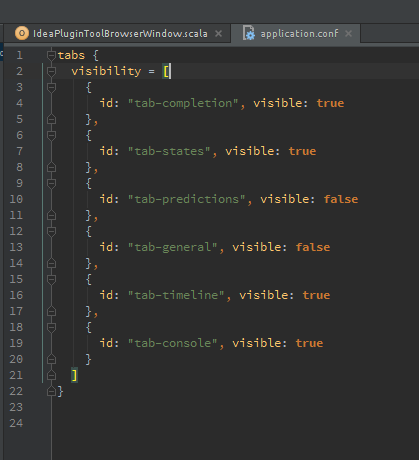
####AID layout configuration
Using this config you can either hide or show AID tabs and what is the best - you don’t need to recompile the whole project.
All you need to do is to reinstall theAID plugin :)
It is essential if you thing about A/B testing!
###Future plans
Only predictions tab is not implemented. It requires changes in AutoMan library.
All the sections described above are beta versions now. Each of them can be extended! Feel free to contact me and suggest changes. I’m waiting :)!